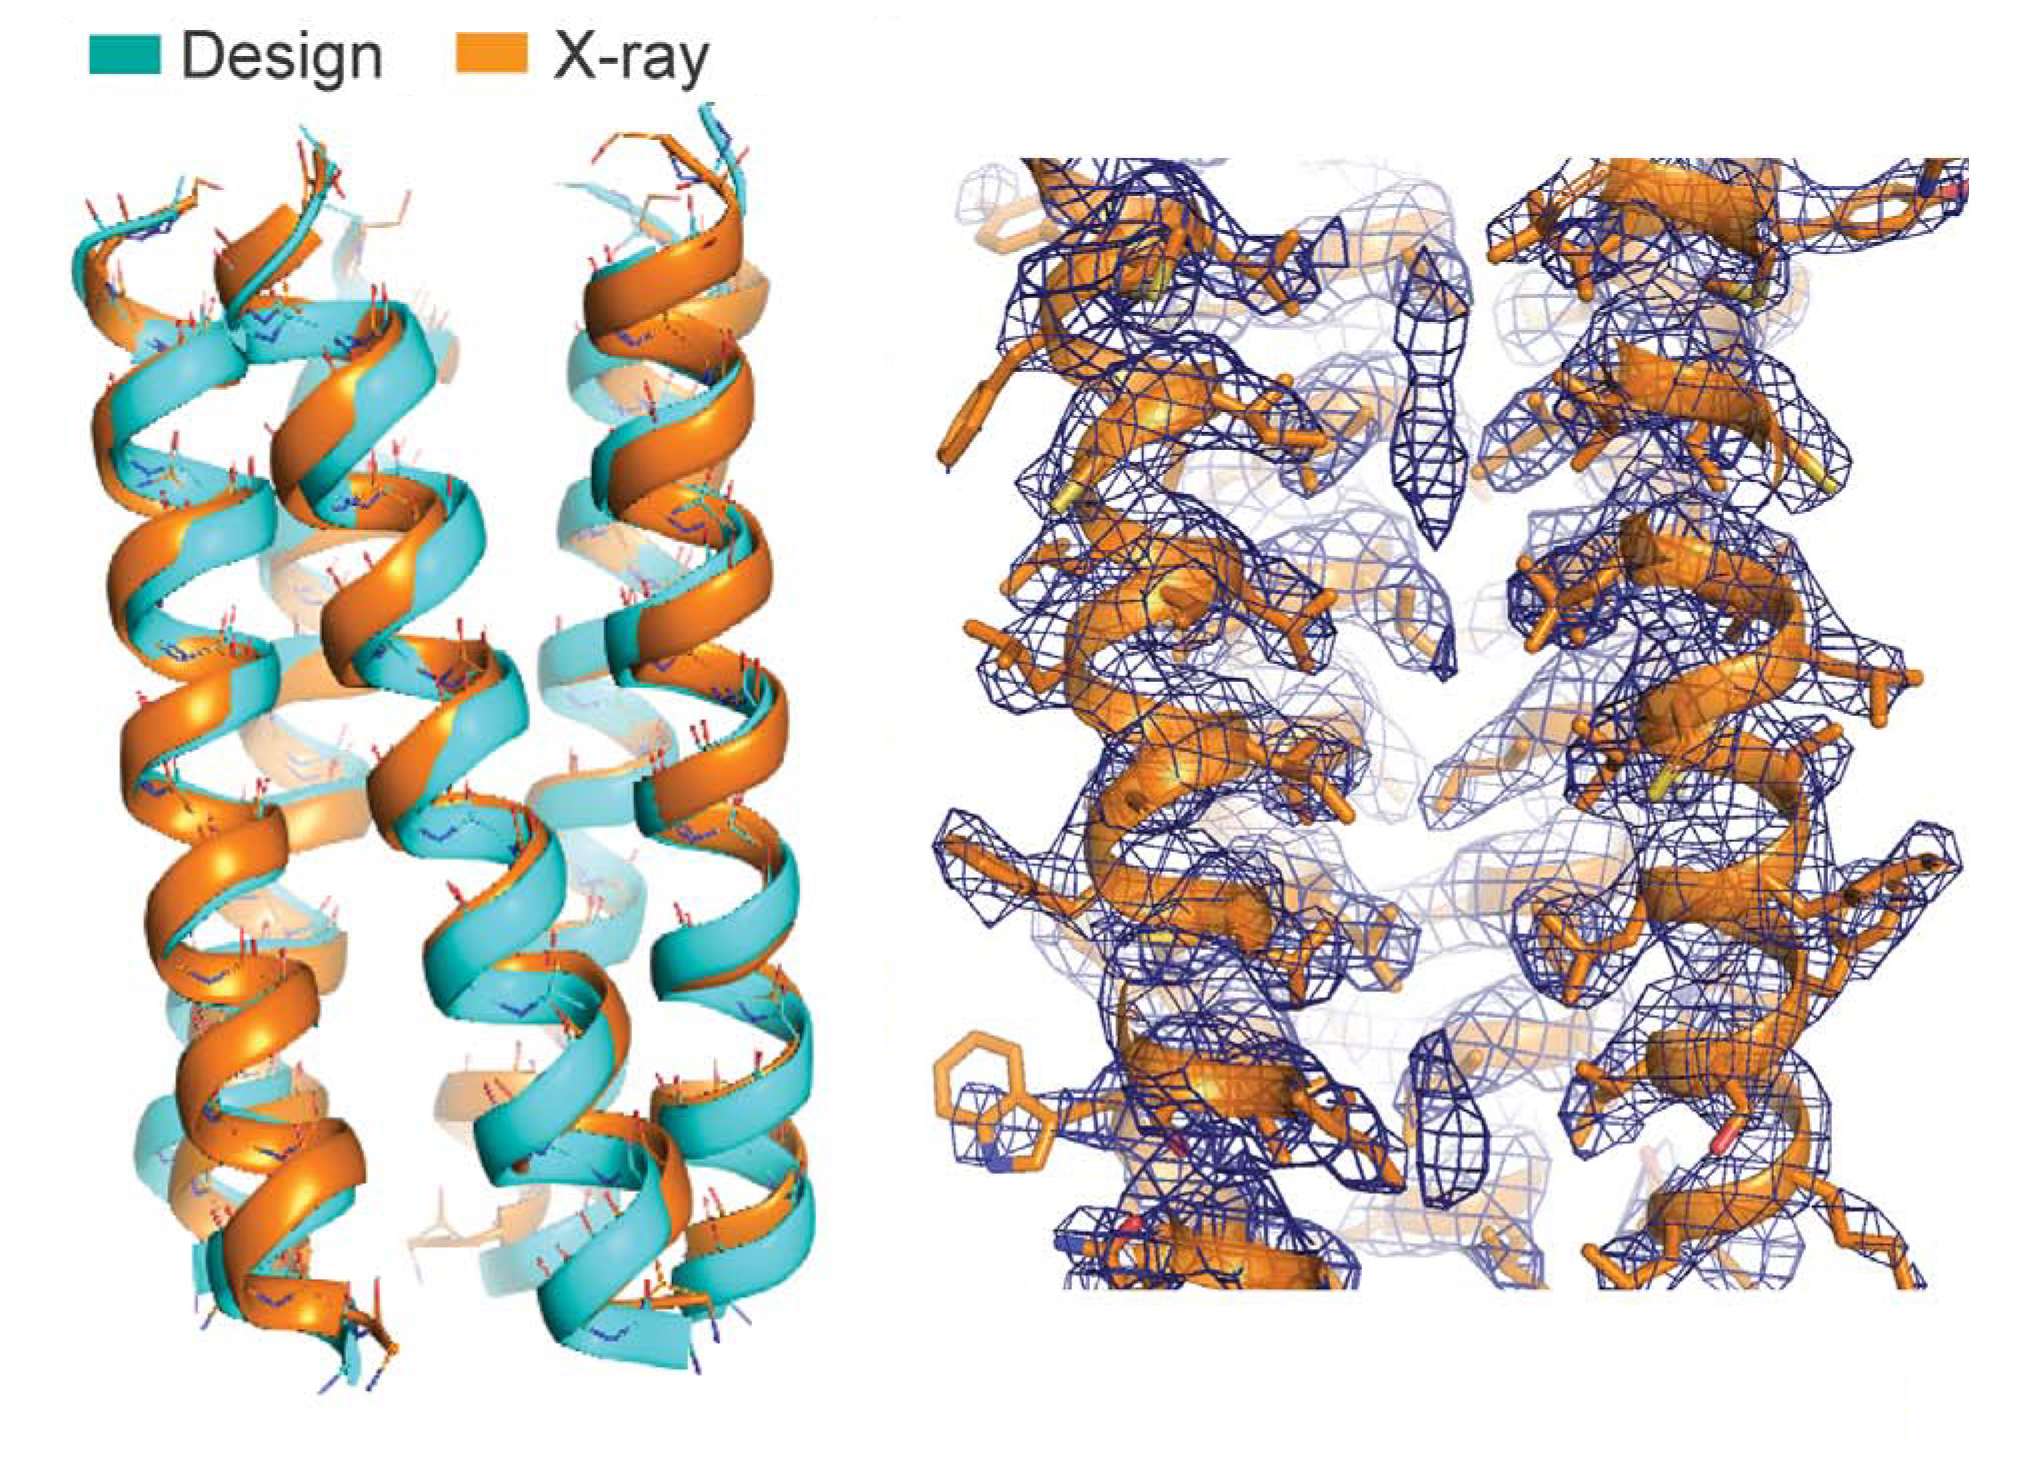
Left: Comparison of the modeled PLN variant (cyan) to the structure obtained from x-ray data (orange). Right: Electron-density map of the PLN variant from the x-ray data shows well-resolved, tightly packed side chains.
Left: Comparison of the modeled PLN variant (cyan) to the structure obtained from x-ray data (orange). Right: Electron-density map of the PLN variant from the x-ray data shows well-resolved, tightly packed side chains.
Was this page useful?

