JBEI’s -omics data visualization tool, Arrowland, facilitates new scientific discovery

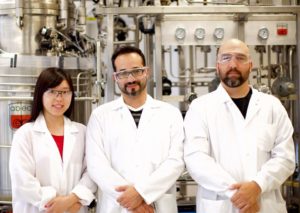
Arrowland developers team. From left: Entrepreneurial Lead, Ling Liang; Principal Investigator, Hector Garcia Martin; and Technical Lead, Garrett Birkel.
Scientists and software engineers at the U.S. Department of Energy (DOE)’s Joint BioEnergy Institute (JBEI) have developed a new -omics visualization tool, Arrowland, which combines different realms of functional genomics data in a single intuitive interface. The aim of this system is to provide scientists an easier way to navigate the ever-growing amounts of biological data generated by the postgenomic revolution. JBEI researchers hope that Arrowland will make it far easier for scientists to reach their next “a-ha!” moment in scientific discovery.
Modern experiment methods in biology can generate overwhelming amounts of raw data. To manage this, scientists must create entirely new workflows and systems capable of merging large, disparate data sets and presenting them intuitively. Arrowland is a combined -omics visualization tool that runs on a web browser, tablet, or cellphone. It shows functional genomics data (fluxomics, metabolomics, proteomics and transcriptomics) together on a zoomable, searchable map, similar to the street maps used for navigation. In addition to providing a coherent layout for -omics measurements, the maps in Arrowland are also an easy-to-use reference for the relationships between the reactions, genes, and proteins involved in metabolism.
“At JBEI we have leveraged the insights provided by metabolic fluxes measured through 13C Metabolic Flux Analysis to make quantitative predictions for E. coli, and we shared these fluxes on Arrowland” said Hector Garcia Martin, Director of Quantitative Metabolic Modeling at JBEI. “By making this cloud-based interactive tool publicly available, our hope is to enable application of this tool in a wide range of fields, not only bioenergy. We are open to collaborations with the broader scientific community and industry.”
Setting itself apart from other available tools, Arrowland is beneficial for its clarity and ease of use. With its unique interface and presentation method, Arrowland makes the exploration of -omics data as intuitive as possible, on a platform that does not require special hardware or configuration. Four different types of -omics data are integrated into the same map – an ability that no competing visualization platforms share – making important correlations and progressions easy to recognize and examine.
Arrowland is open-source and currently under active development, with plans to add more maps, editing and curation features, and is integrated with an open-source modeling package that JBEI plans to release separately, called the JBEI Quantitative Metabolic Modeling Library. For the time being, a sample data set from the flux profiles published in “A Method to Constrain Genome-Scale Models with 13C Labeling Data”, PLOS Computational Biology (Garcia Martin et al, 2015) can be viewed at http://public-arrowland.jbei.org.


